Yellowstone National Park Sets Record for May Visitation
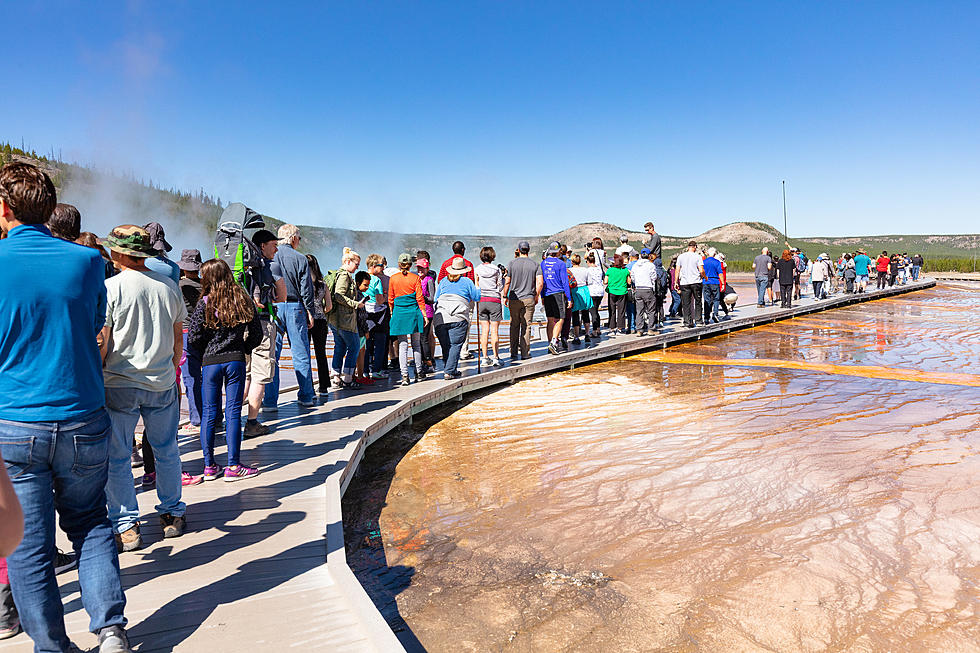
Yellowstone National Park just released recreational visitation statistics for May 2021 and announced that it was the park's most visited May on record.
YNP hosted 483,159 recreation visits in May 2021, which is an 11% increase from May 2019. In 2020, the park was closed from May 1 through May 18. Only two of the park's five entrances were open for the rest of the were open from May 18 through May 31.
So far in 2021, the park says it has hosted 658,513 recreation visits. That's up 14% from 2019.

YNP is expecting a very busy summer, and if the visitation numbers so far this year are any indication, it could be a record year for the park. Millions of people are expected to visit the park in June, July and August.
Here's a look at visitation numbers for Yellowstone National Park through May in previous years.
- 2021 – 658,513
- 2020 – 145,849 *The park was closed from May 1 through May 18. Two entrances were open from May 18 through May 31.
- 2019 – 576,776
- 2018 – 570,823
- 2017 – 550,486
- 2016 – 593,755
If you're planning a trip to Yellowstone National Park, make sure you're prepared and plan ahead. Also, it's going to be a busy summer in the park, so it will be crowded. Most park lodging and camping is reserved or full. Please be patient and flexible. Yellowstone is a big place. Traffic, wildlife along and on roads, and road construction often make drive times longer than expected.
The National Park Service also asks that visitors take the Yellowstone Pledge.
I pledge to protect Yellowstone National Park. I will act responsibly and safely, set a good example for others, and share my love of the park and all the things that make it special.
For more information about visiting Yellowstone National Park, click here.
LOOK: Here are the best small towns to live in across America
LOOK: See how much gasoline cost the year you started driving
Gallery Credit: Sophia Crisafulli
More From 100.7 KXLB


